
8% EBITDA. $125K in the bank. $100K payroll due Wednesday.
Profitable and liquid are not the same thing. Here's the gap nobody explains, and why it will find you eventually.

We were growing 30% year over year. EBITDA was running around 8%. By every standard metric, the business was healthy.
But we only had $125K in the bank and a $100K payroll to make on Wednesday.
I’d already mapped out the week dollar by dollar. Incoming receipts, credit card payments, sales tax, payroll timing. We were on a payment plan with our biggest supplier. I’d personally called several other vendors to tell them we’d be paying late. I was running out of moves.
The founder checked in on the #finance Slack Monday morning: “How’s cash looking? Are we good for payroll on Wednesday?” I typed back “Little tight but we’ll be fine.” while staring at 10 Excel windows on my second cup of coffee before 8am. Truth was, it was going to be close.
We ended up making payroll. But it was way tighter than it needed to be.
I was tracking cash. But I was relying too much on back-of-the-napkin math and it wasn’t good enough. And sitting there, answering that Slack message with half the truth, I decided I wasn’t going to do that again.

Your P&L doesn’t tell you about Wednesday.
It tells you what you earned. It doesn’t tell you when the cash actually moves. When your Shopify payout hits. When the supplier invoice is due. When payroll clears. When the credit card statement closes.
You could be doing $20M, showing 8% EBITDA, and have $125K in the bank on a Wednesday in September. The P&L isn’t lying. It just wasn’t built for this question.
This isn’t a scrappy startup problem either. It happens at $5M and at $50M. The mechanism is the same. The dollar amounts just get more interesting.
Four reasons the gap keeps showing up
1. Revenue timing vs. cash timing. Shopify payouts lag 1-3 business days. On a $300K/week revenue pace, that’s real money sitting somewhere that isn’t your bank account, and it resets every single week. It’s the 3 dots in iMessage, except the message is $150K.
2. Inventory as a forward cash commitment. Every PO you sign is a cash outflow before a single sale happens. You fund Q4 in September. Revenue shows up in November. Your bank account reflects the wire the day it went out. And the faster you grow, the quicker this compounds.
3. Seasonal cash compression. BFCM is the best week of the year and also, quietly, the eye of the storm for cash. You collect revenue, pay down suppliers, then find yourself short when the next PO comes due. Returns land in January. Then February arrives like a bar tab you stopped keeping track of around midnight.
4. Fixed obligations don’t negotiate. Payroll is semi-monthly. Rent is the first of the month. Your credit card balance comes due whether it was a record week or the week your Meta account got hacked and you lost 3 days of revenue. (Yes, this happened to me.) These dates don’t move.
The real tool that closes the gap
You don’t need me to tell you “use a 13-week cash flow model”. That’s the easy part. But does your 13-week cash flow model give you an accurate picture of which week your cash drops below your minimum target, whether you need to draw on your line of credit this week or next, and whether the PO you’re about to sign is actually fundable? In my mind, this is the number one most essential tool for a DTC finance operator to get right. Really right.
This may sound basic in a sense, but if you’re not tracking it at the correct level of detail or don’t have a regular cadence for updating it each week, you’re flying the plane half blind.
I’m talking about layering in cash settlement schedules, payment processor fees, PO terms by supplier, payroll schedules, line of credit mechanics, sales tax remittance estimates, and ad spend schedules. These things will make your cash flow model the underrated backbone of your brand’s growth trajectory.
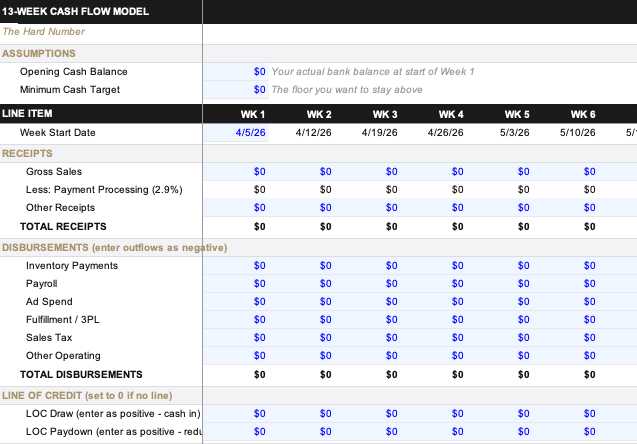
Here’s the basic version of the model I use. Shopify receipts netted to actual cash, weekly disbursements by category, line of credit draw logic, straightforward to update. Run it every Monday morning (just make sure you track those weekend cash remittances).
→ Basic DTC 13-week cash flow model
(Click the link then download to Excel)
We’ll dive deeper on what a fully optimized DTC 13-week cash flow forecast looks like together soon. And how AI plugs in. For the time being, think through your weekly cash flow process. Are you ready for a week like I had?
See you next week.
We’ll talk about the time we thought we were profitable. Until we weren’t.
P.S. I’m giving the bar tab line a 6/10. It felt right in the moment.
I’m Brad Schroeder. A DTC finance operator in the seat. I rate my own jokes.

Find me on LinkedIn.